
Analytics
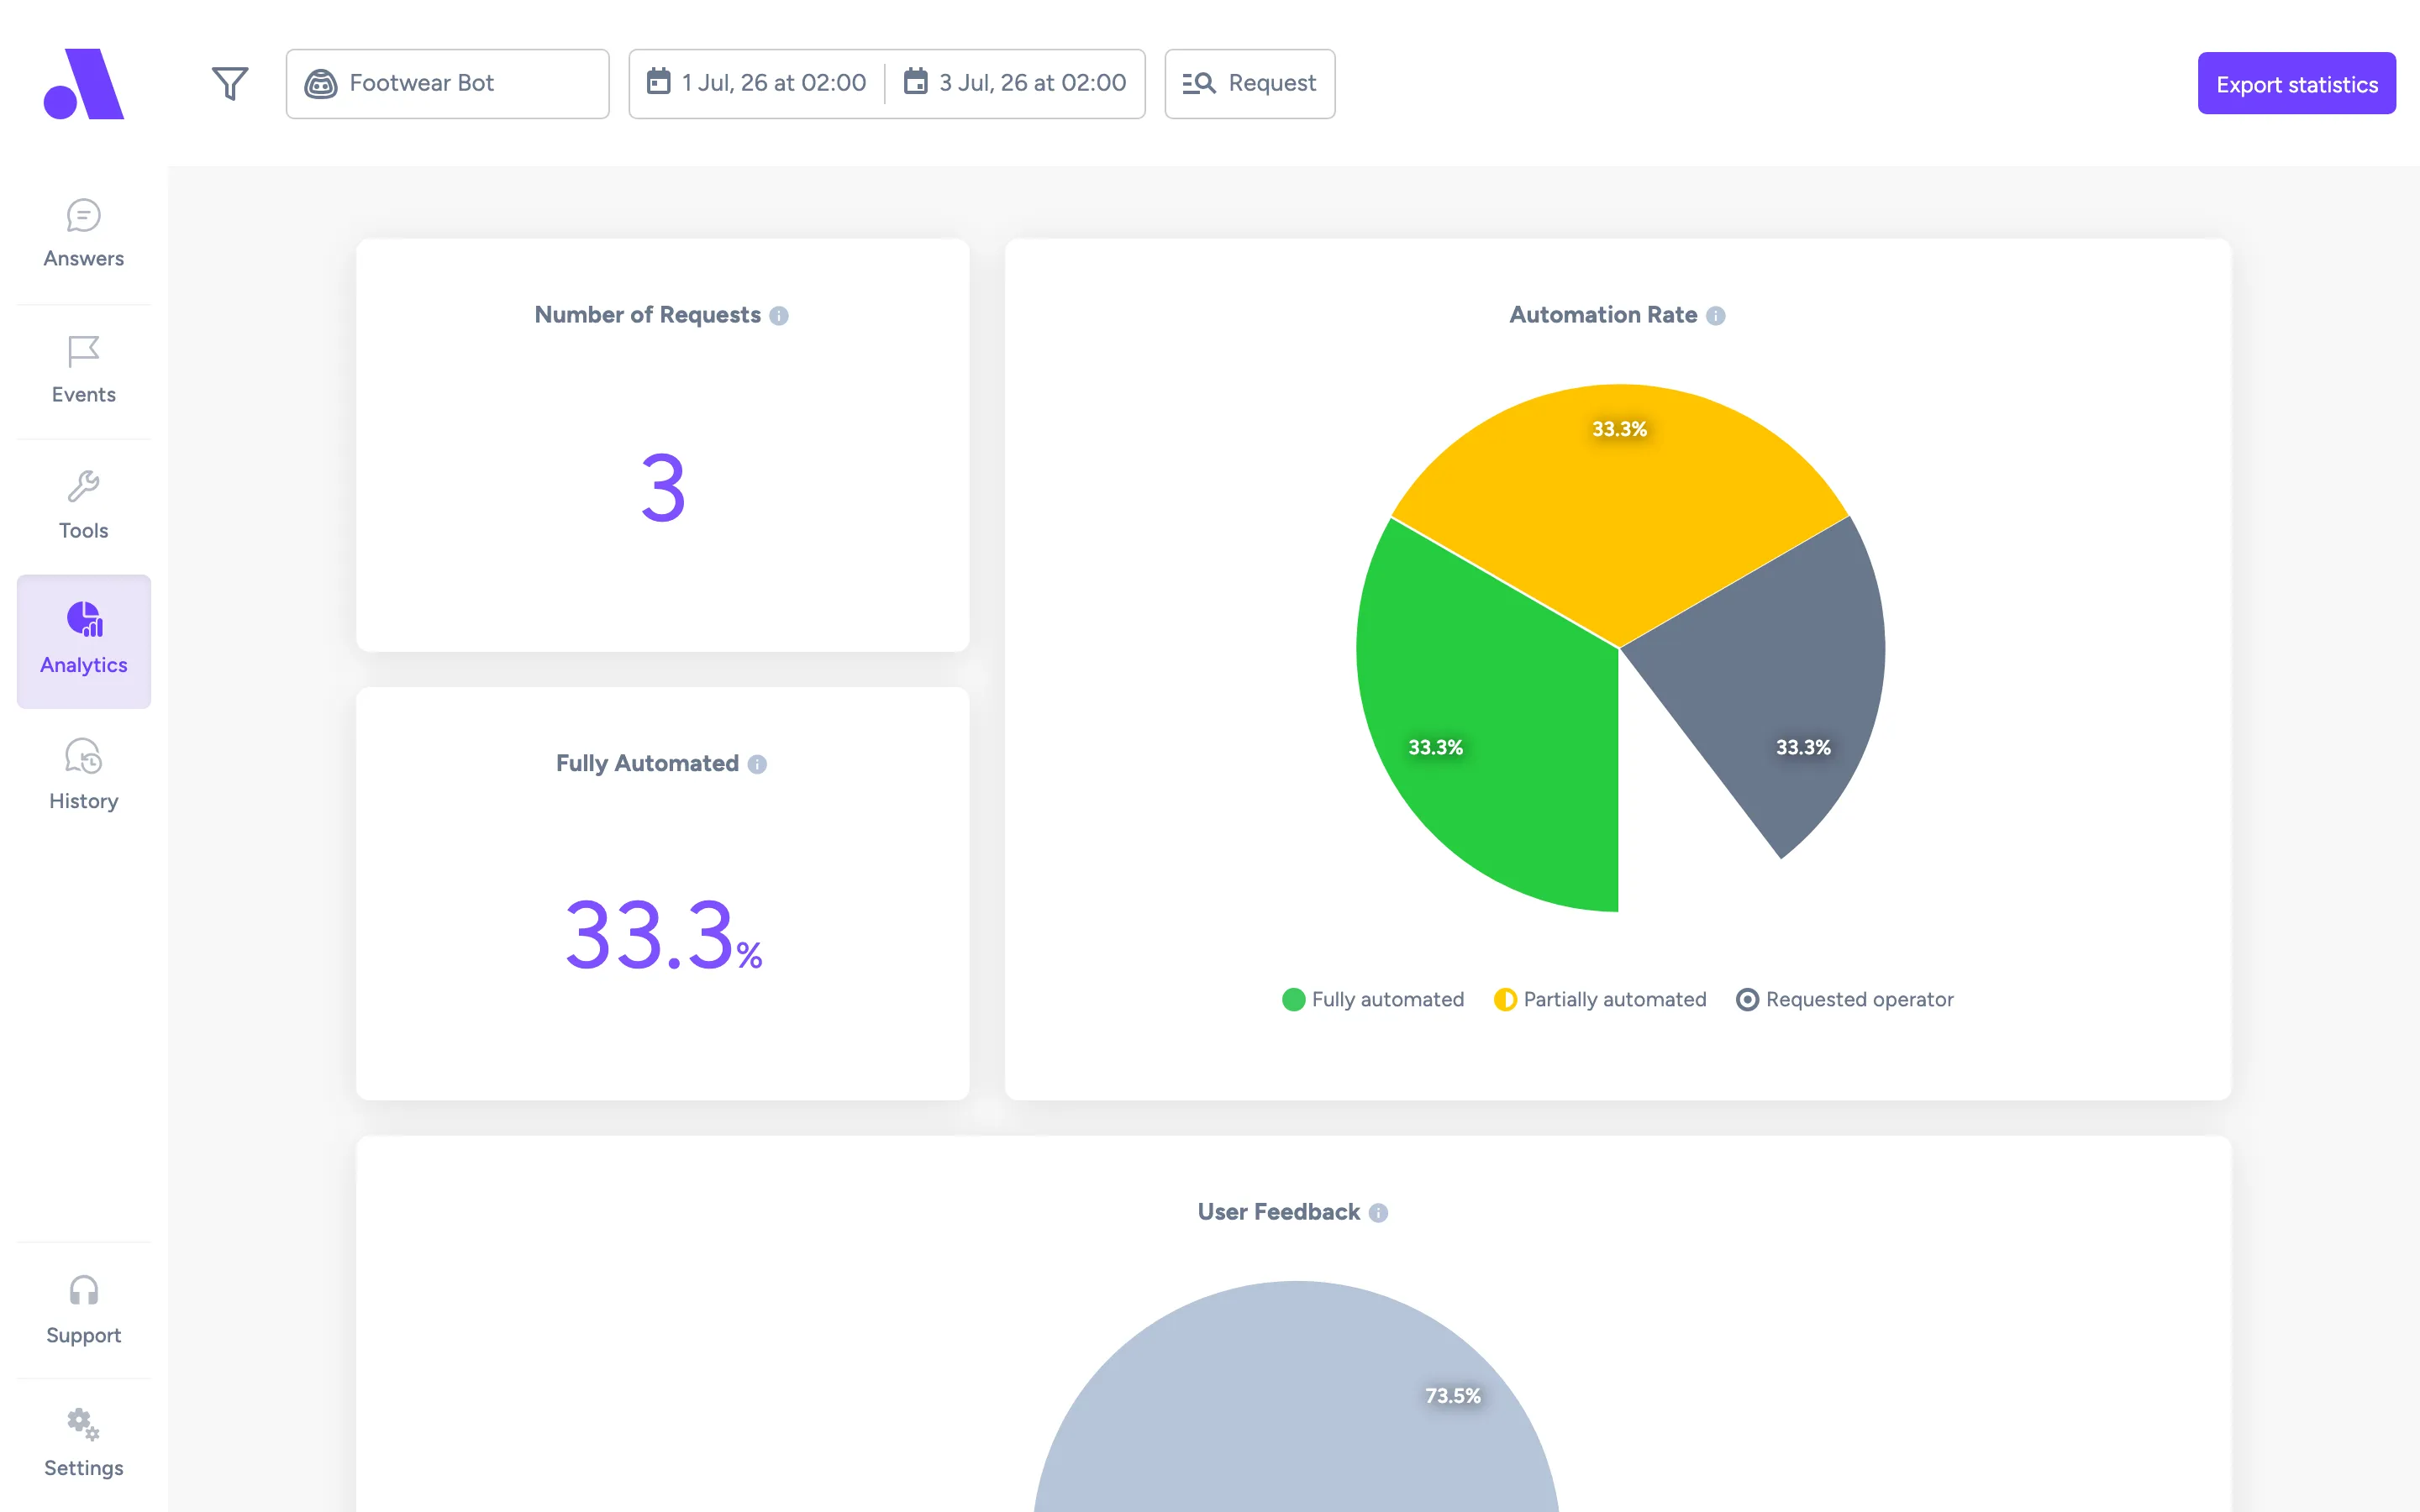
The Analytics screen (/analytics) shows how your bots performed in a period. Use the filter menu at the top to choose bots, markets, channels and dates, and Export statistics to download the numbers as a CSV file.
What you can do here
Section titled “What you can do here”- Narrow the data with the filter menu (the funnel icon). Active filters appear as badges next to it.
- Switch between counting requests and counting contacts with Granularity.
- Hover the info icon next to a chart title to read what it measures.
- Click Show Answers in the Assistance Resolution tooltip to see the answers behind a point in time.
- Download the data with Export statistics.
Filter the data
Section titled “Filter the data”- Click the funnel icon in the top bar.
- Choose a filter in the list: Virtual Assistants, Markets, Date from, Date to, Granularity or Channels. Markets only appears when your bots have markets.
- Click Filter Results. Click Reset Filters to go back to the defaults.
Export statistics
Section titled “Export statistics”- Click Export statistics.
- Set Date from and Date to.
- Tick the bots to include. With more than five bots you get a search box and Select all / Deselect all buttons. If you have both chat and email bots, there are also Select all chat and Select all email buttons.
- Click Export. Amio shows “Generating your CSV — this may take a couple of seconds.” and downloads a file named
bot-statistics-<from>-<to>.csv.
Charts and metrics
Section titled “Charts and metrics”Request and contact are the two ways to count. A request starts with a customer enquiry (“Hello, I’m looking for my PIN.”) and ends when the enquiry is completely solved, even unsuccessfully. A contact is a customer who made at least one interaction with your business through a messaging channel. A contact can have multiple requests.
| Chart | What it measures |
|---|---|
| Number of Requests / Number of Contacts | The total count for the period. The title follows the Granularity filter. Tooltip: the definition of a request or contact above. |
| Fully Automated (%) | By request: how many requests were automatically answered by the bot. By contact: the percentage of contacts with at least one Fully Automated request. The tooltip adds that this is not correlated with customer satisfaction, and points you to the User Feedback chart for that. |
| Automation Rate | A pie chart of request outcomes. By request, it sums up the outcome of every request per category. For example, a contact with requests “Fully automated”, “Fully automated” and “Wrong answer” adds 2 to Fully automated and 1 to Wrong answer. By contact, it shows how many contacts met each outcome, so the same contact adds 1 to each. |
| User Feedback | Counts bot responses (one per customer request) in the selected period, bots and channels, grouped by the customer’s latest rating of that response. Thumbs up and Thumbs down come from the thumbs in Amio Chat, or a Yes / No answer in a feedback block. Not rated is every other bot response, including channels that do not show the thumbs. Always counted per request, whatever Granularity says. |
| Most used Answers | A stacked bar chart of the answers used most, split by outcome. Hover a bar to see the share of each outcome and the total usages. Email bots show Fully automated and Requested operator. Other bots show Fully automated, Partly automated and Wrong answer. |
| Total Answers | Published answers (left number) compared with the total number of answers (right number). |
| Answer table | Under the bar chart. Tooltip: a comprehensive view of answer performance, such as which answers are used the most and which need to be improved. Columns: #, Answer, Usage Rate, Fully Automated, Partially Automated (Requested Operator for email bots), Wrong Answer and Requested Operator. Each answer links to its editor. Only published answers are listed. |
| Assistance Resolution | An area chart over time of how requests were resolved (by request) or how many contacts received each type of assistance (by contact). In the contact view, one contact can appear in several categories if its requests got different types of assistance. |
Outcome and resolution labels
Section titled “Outcome and resolution labels”The pie charts and legends use these labels. The tooltip text is what the UI shows when you hover them.
| Label | What it means |
|---|---|
| Fully automated | The virtual assistant understood the customer’s intent, and then provided an answer which successfully resolved the customer’s query. |
| Partially automated | The virtual assistant understood the intent, and provided an answer which partially resolved the query. Improving the answer (providing all options, answering edge cases, and so on) could recategorize these as Fully automated. |
| Wrong answer | Either the virtual assistant misunderstood the intent and gave an incorrect answer, or the answer did not satisfy the customer. |
| Not automated | Either the virtual assistant failed to understand the intent, or no answer was created for it. |
| Requested operator | The customer requested to Call Operator. |
| Served by bot | Every request of this contact was resolved correctly by the bot. |
| Served by operator | A customer asked for an operator and the operator actually came. |
| Operator not reachable (offline) | A customer asked for an operator but the operators were offline. |
| Operator not reachable (timeout) | A customer asked for an operator and the operators were online, but the chat timed out before an operator served the customer. |
| Thumbs up / Thumbs down | The customer rated the bot response with a thumbs up or down, or answered Yes or No in a feedback block. |
| Not rated | The customer did not rate the bot response. |
The “Unknown/Generated answer” row in the answer table has its own tooltip. If the request counts for Usage Rate and Request Outcomes do not match, some requests were not automated, and the Unknown/Generated answer did not use AI to respond to those requests.
Assistance Resolution chart controls
Section titled “Assistance Resolution chart controls”The chart has a toolbar with Selection zoom, Panning, Zoom in, Zoom out and Reset to original range. Show summary opens a side panel with a pie chart of assistance types for the whole period. Hover a point on the chart and click Show Answers to open a panel with the answer usages for that period. Use the arrows at the top of the panel to move between periods, and the Assistance Resolution list on the left to filter by resolution.
Fields
Section titled “Fields”| Field | What it does |
|---|---|
| Virtual Assistants | Which bots to include. |
| Markets | Which markets to include. |
| Date from / Date to | The period shown. |
| Granularity | Request or Contact. Changes how the Number, Fully Automated, Automation Rate and Assistance Resolution charts count. |
| Channels | Which channels to include. |
| Export statistics: Date from, Date to, Bots | The period and bots for the CSV export. These are set separately from the page filters. |
Related
Section titled “Related”- History screen, to read the conversations behind the numbers
- Answers screen, to improve answers with a low automation rate
- How the bot works
- Best practices